What is a good bounce rate for a website? (and industry benchmarks)
When you first see your bounce rate of x%, it can be confusing making you think about what it is, is it good to have a higher or lower bounce rate, how is it being calculated for my site, what are some industry benchmarks, what can I do to improve it, etc. Let’s answer all questions.
- Understanding Bounce Rate
- What is considered a good bounce rate in 2025?
- How to check my website’s Bounce rate?
- Interpreting bounce rate data
- How to decrease your bounce rate?
- Bouncing off 👋
Understanding Bounce Rate
Imagine you have a website with ten pages. You get visitors from different sources like social media, paid campaigns, organic search, referrals, etc.
You ideally want these visitors to engage with your website and maybe take some necessary actions like signing up. For that to happen, the visitors would need to take any of the following actions:
- Engage with more than one page.
- Take a conversion action.
Essentially, the percentage of visitors who are not taking any of these actions during their session is the bounce rate. A visitor to a website is said to have “bounced” away when they leave without interacting further with your website.
They could leave by pressing the back button of their browser, closing the tab, or going to another website. Website owners should typically aim for low bounce rates.
High bounce rates indicate low user engagement, meaning visitors may not be finding your content engaging or relevant enough to explore further, although there are some exceptions to that understanding as you will see in a bit.
Bounce rate formula
Bounce Rate = (Total single-page sessions / Total Sessions) * 100
Where:
- Total single-page sessions is the number of sessions in which users only visited one page before leaving the website.
- Total sessions is the total number of sessions for that page or website.
This formula gives a percentage indicating how often visitors leave immediately after arriving. The bounce rate metric is key to understanding engagement on a specific page or site.
In addition to this, if a visitor takes specified actions on the website, and even if they don’t visit another page, it is still considered an engaged session and doesn’t count towards the bounce rate.
Bounce rate vs Engagement rate vs Exit rate
Bounce rate is the opposite of engagement rate. If you measure the percentage of visitors who engage, i.e. take any of the aforementioned actions, with your website in a specific time period, you will get your engagement rate.
The exit rate is the percentage of visitors who leave a website from a specific page, regardless of whether they engaged with the content or navigated through other parts of the site before exiting. This helps in understanding the top most pages from which your visitors typically exit the site.
Optimizing these metrics is critical for enhancing user experience and, ultimately, conversion rates.
What is considered a good bounce rate in 2025?
The general understanding is that lower the bounce rate, the better it is. It is because this means that your entry pages are capable of prompting visitors to engage with the site and that you are attracting the right kind of audience.
But it also depends. It depends how much bounce rate you should be expecting based on:
- The industry you are operating in.
- Whether you deal in B2B or B2C.
- The nature of the entry page from which visitors bounce off.
- The kind of content you made (original, general, with engaging elements like a video or calculator, etc.)
Let’s see why.
Bounce rate benchmarks by industry (in descending order)
Bounce rates vary significantly by industry and the type of entry page.
We have created these ranges based on reported average bounce rates from studies conducted by digital marketing agencies and tools like HubSpot, Siege Media, etc.
Content websites and pages: 65% - 90%
Content sites or such pages/sections in a website like blog, news portal, glossary, references, help articles, often have the highest bounce rates.
For eg. A visitor clicks on an interesting news piece about a new scientific discovery from their social media feed, reads that particular piece, and leaves the site. Generally, there’s no other engagement involved.
If, however, the site engages users with gated content, mandatory forms, etc., the bounce rate becomes moderate, reaching as low as 30%. But, these strategies shouldn’t be employed for the sake of reducing bounce rates and the priority should always be creating people-first content.
Landing pages: 60% - 90%
Landing pages are designed for conversions. Counter-intuitive but landing pages experience one of the highest bounce rates and there’s a lot of room for improvement. It is surely a red flag and what needs to be optimized is highly contextual.
For eg. You may need to communicate the value of a particular feature better through the landing page, make it less annoying if there are too many calls-to-action or desperate attempts to sell, or it may so happen that it is a single-page site of a freelancer and that’s why it experiences a high bounce rate by default.
Service industry websites (Legal, Automotive, etc.): 50% - 70%
Service-based sites generally have moderate bounce rates, as visitors may be researching but not immediately ready to contact or convert.
B2B websites: 25% - 65%
B2B sites tend to have lower bounce rates as users often conduct thorough research and may view multiple pages before making decisions.
If your B2B site’s bounce rate is less than 30%, you are doing a great job.
Travel and Hospitality: 40% - 60%
Visitors research and compare various options, which can lead to moderately high bounce rates, although this can vary based on page type.
Real Estate: 30% - 55%
Real estate sites see varying bounce rates, with users frequently engaging with multiple listings and search filters.
Retail & eCommerce websites: 20% - 55%
Retail and eCommerce sites usually have lower bounce rates as most visitors browse products, explore options, check details, create wishlists, share products, etc. Even if they don’t make a purchase, the high engagement rates make them have one of the lowest bounce rates across industries.
A rule of thumb to go by
Looking at the ranges above, your bounce rates can vary anywhere from 20% to 90%, depending upon your industry and types of pages.
We believe a good benchmark for bounce rate is aiming for 50% or lower across your entire site. This indicates that visitors are finding your content engaging and are encouraged to explore the site.
How to check my website’s Bounce rate?
To check your bounce rate, your traffic needs to be analyzed for some time and for that you need a web analytics tool like Plausible. When you implement Plausible on your site, bounce rate is available as a key metric at the top of the dashboard by default, with no special configurations needed.
Check out our website’s live stats here to get a glimpse. You will also be able to see the percentage increase or decrease in the bounce rate over the selected time range and analyze your growth patterns.
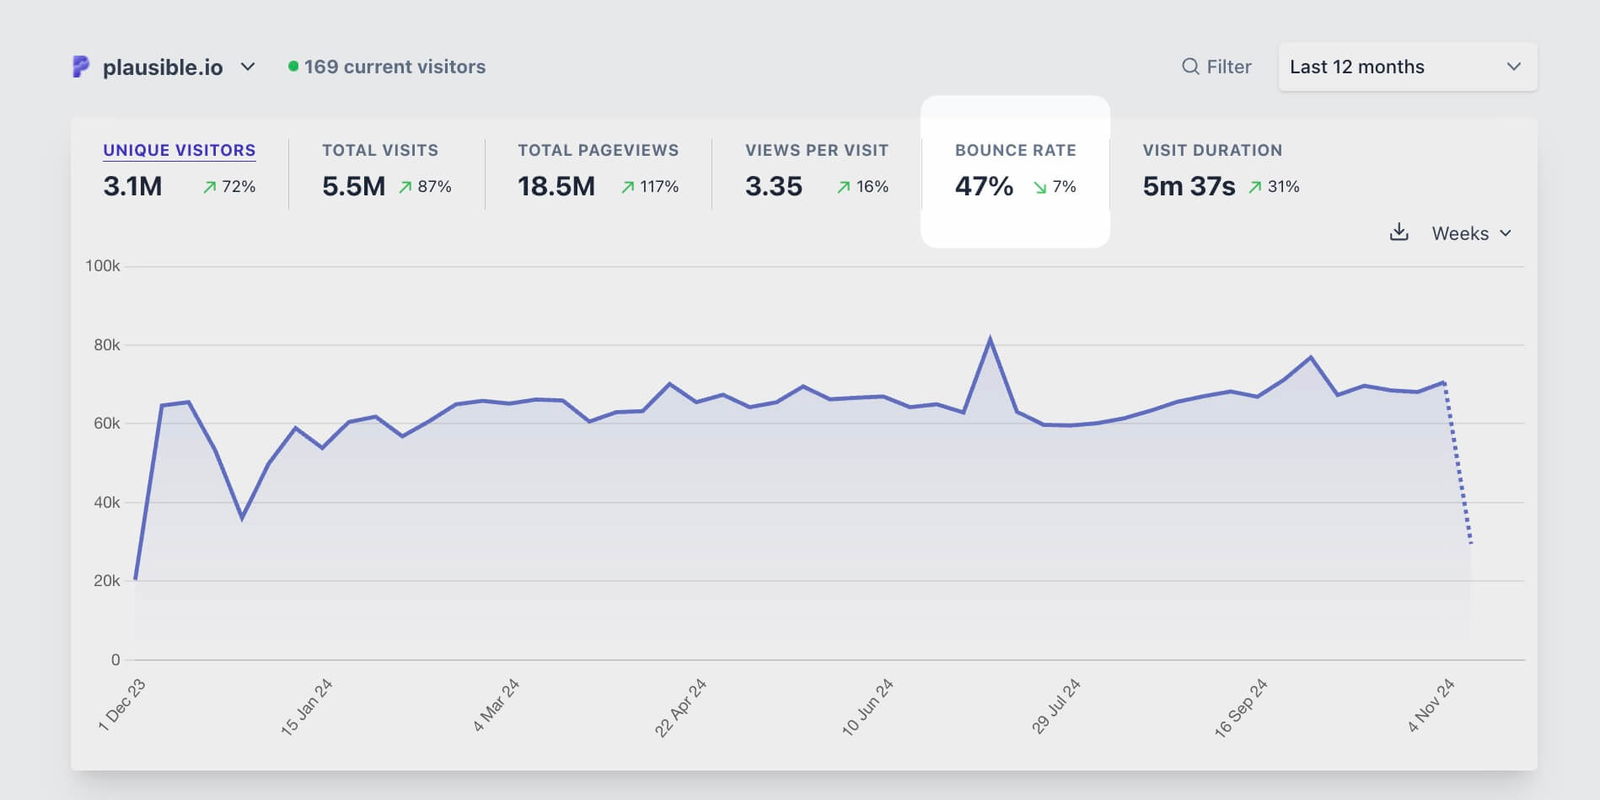
You can also monitor the bounce rate for individual pages, specific segments, or particular sections of your site.
Interpreting bounce rate data
So you found your site’s bounce rate. What about individual pages as each of them would have different bounce rates? What about the sessions acquired through your traffic sources.
It is very easy to segment your bounce rates by plenty of different dimensions tracked for your site. Even a combination of different filters (essentially creating audience segments) is possible.
By segmenting bounce rates by page, source, device, etc., you can also see how your metrics compare to the site’s average bounce rate.
Segment bounce rate by pages
The bounce rate can tell you a lot about how your page is performing. It reveals whether or not visitors are engaged with your content and if they view other pages on your website or complete conversion actions, after landing on the initial page.
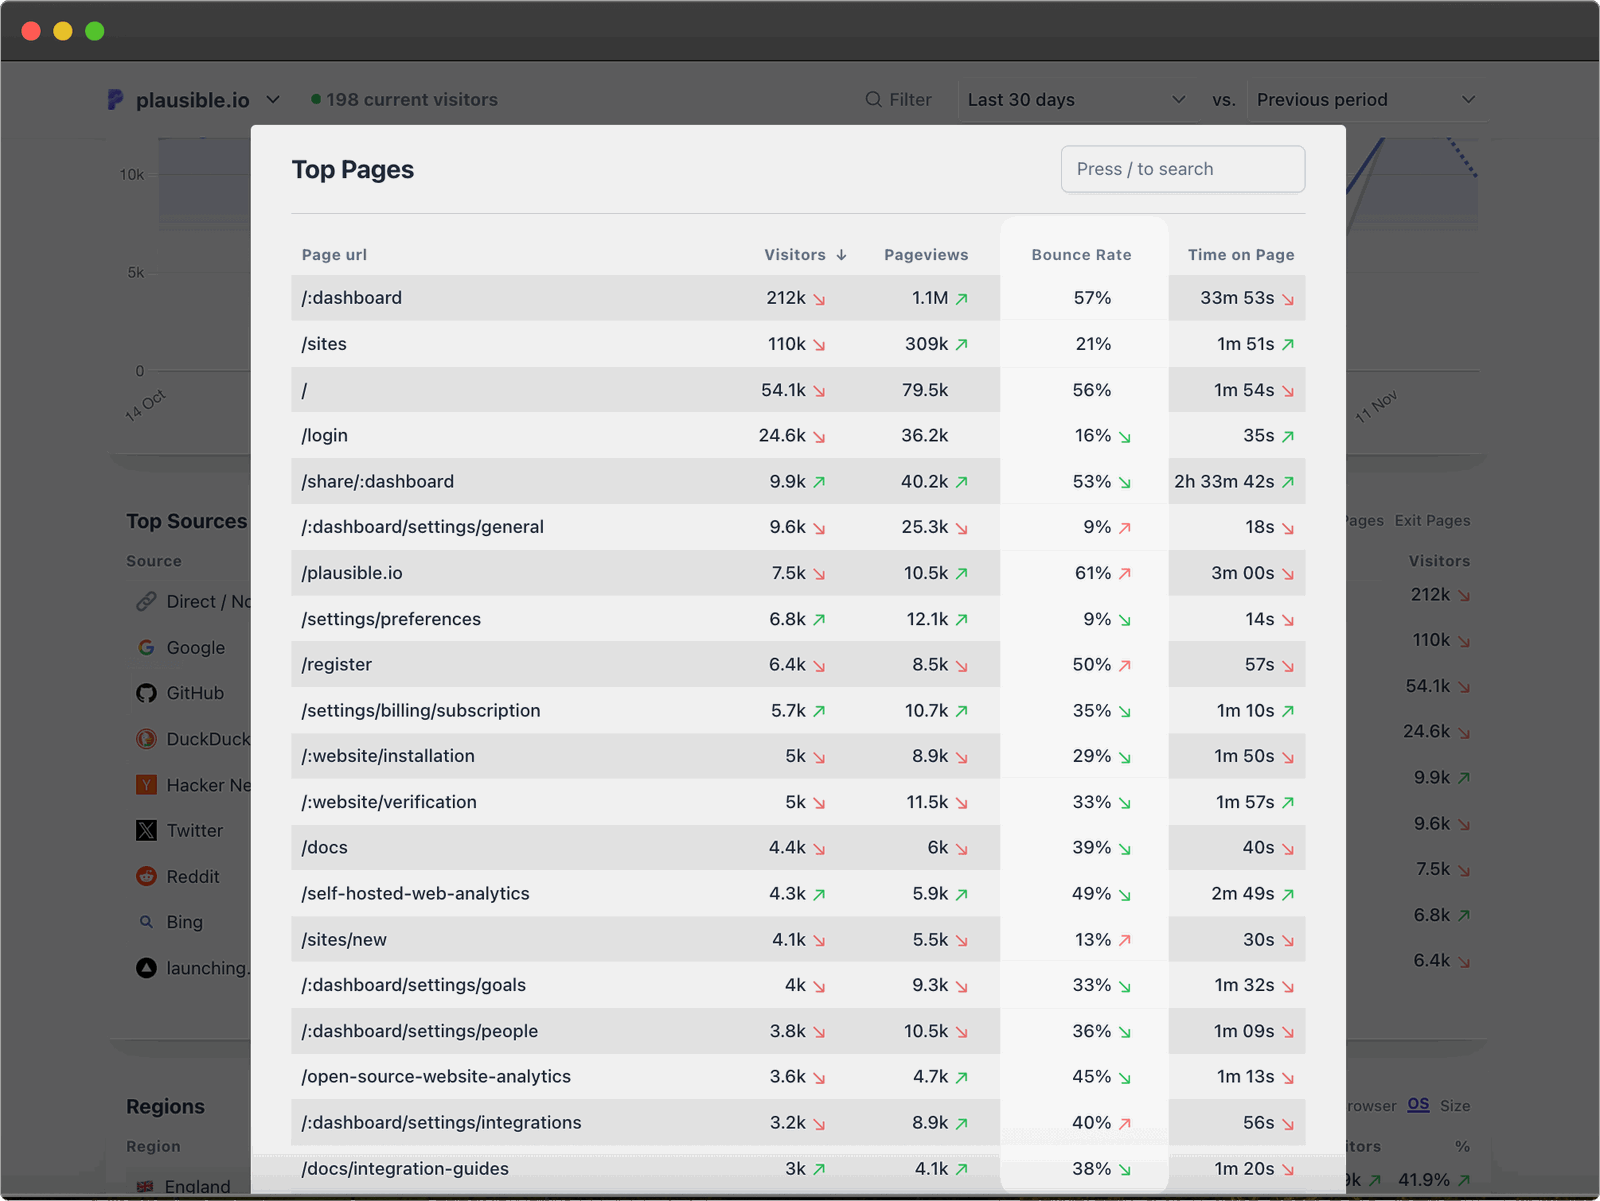
In Plausible, you get a “Top Pages” report out of the box. Clicking the associated “Details” button shows the bounce rate for each page separately. You can even sort your list of pages by bounce rate in ascending or descending order.
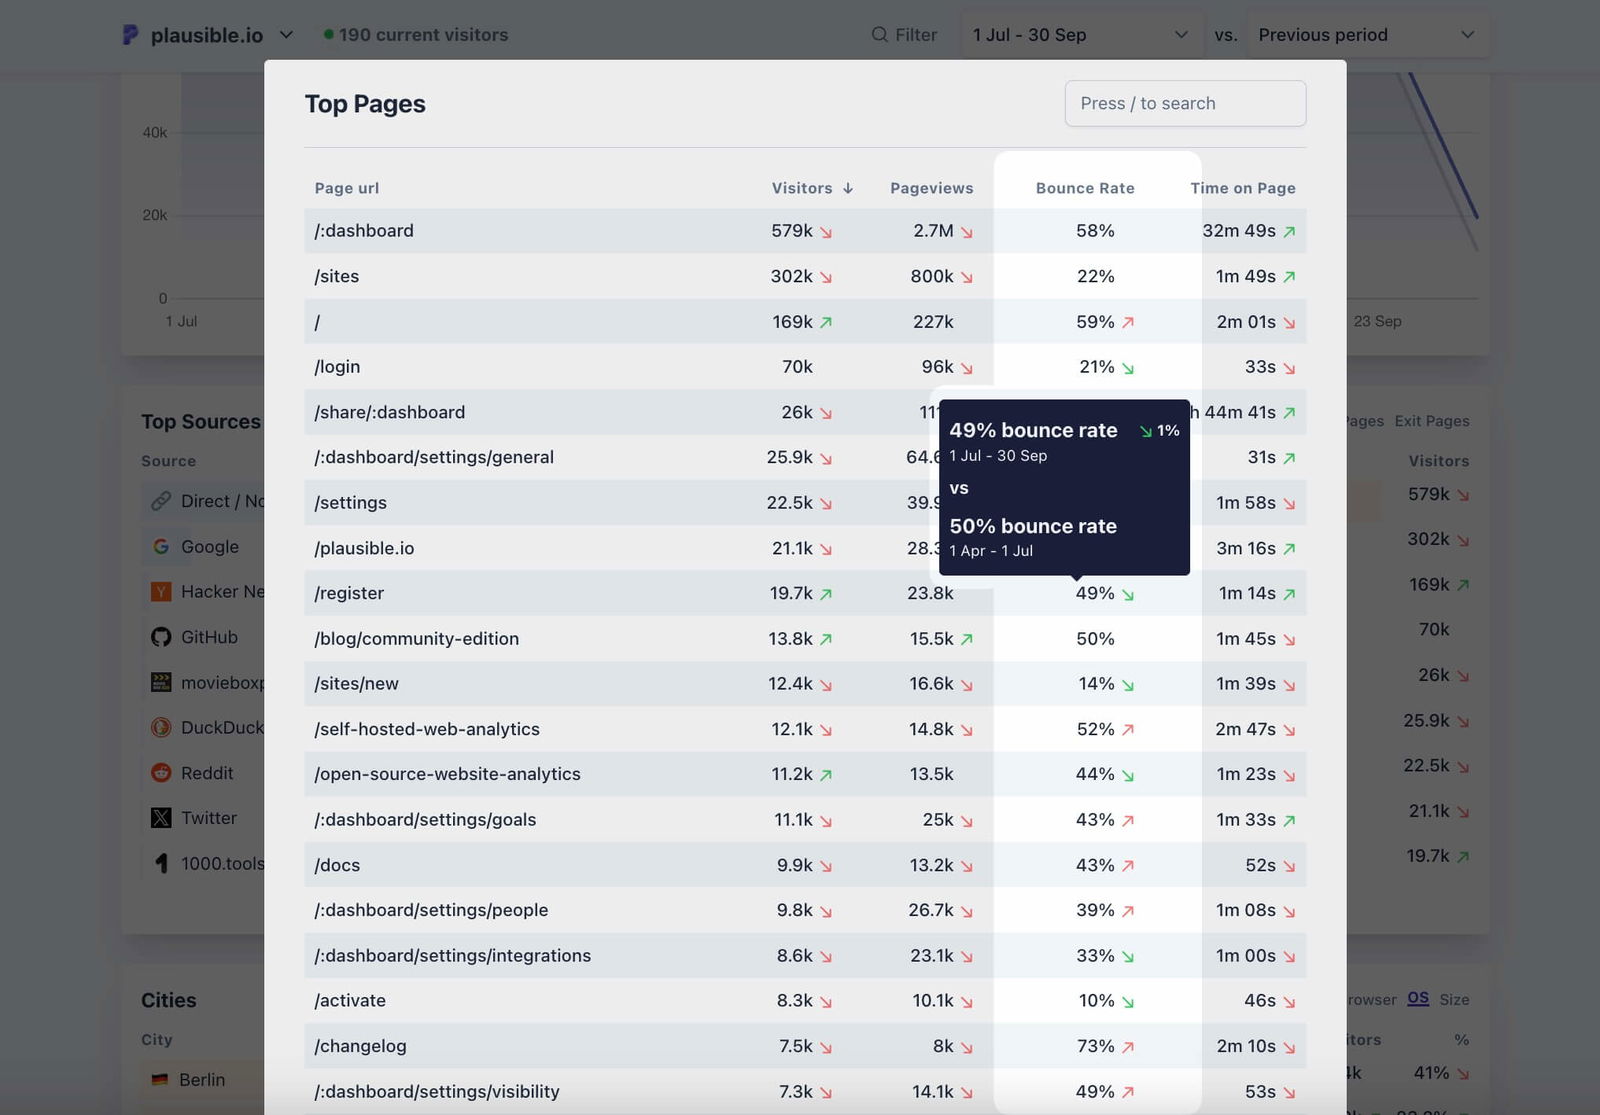
Clicking on any entry (or using the Filter option) in this report segments your dashboard and all metrics by the sessions associated with that page view.
For eg., We compared the bounce rate on our sign-up page in Plausible between Q2 and Q3 of 2024.
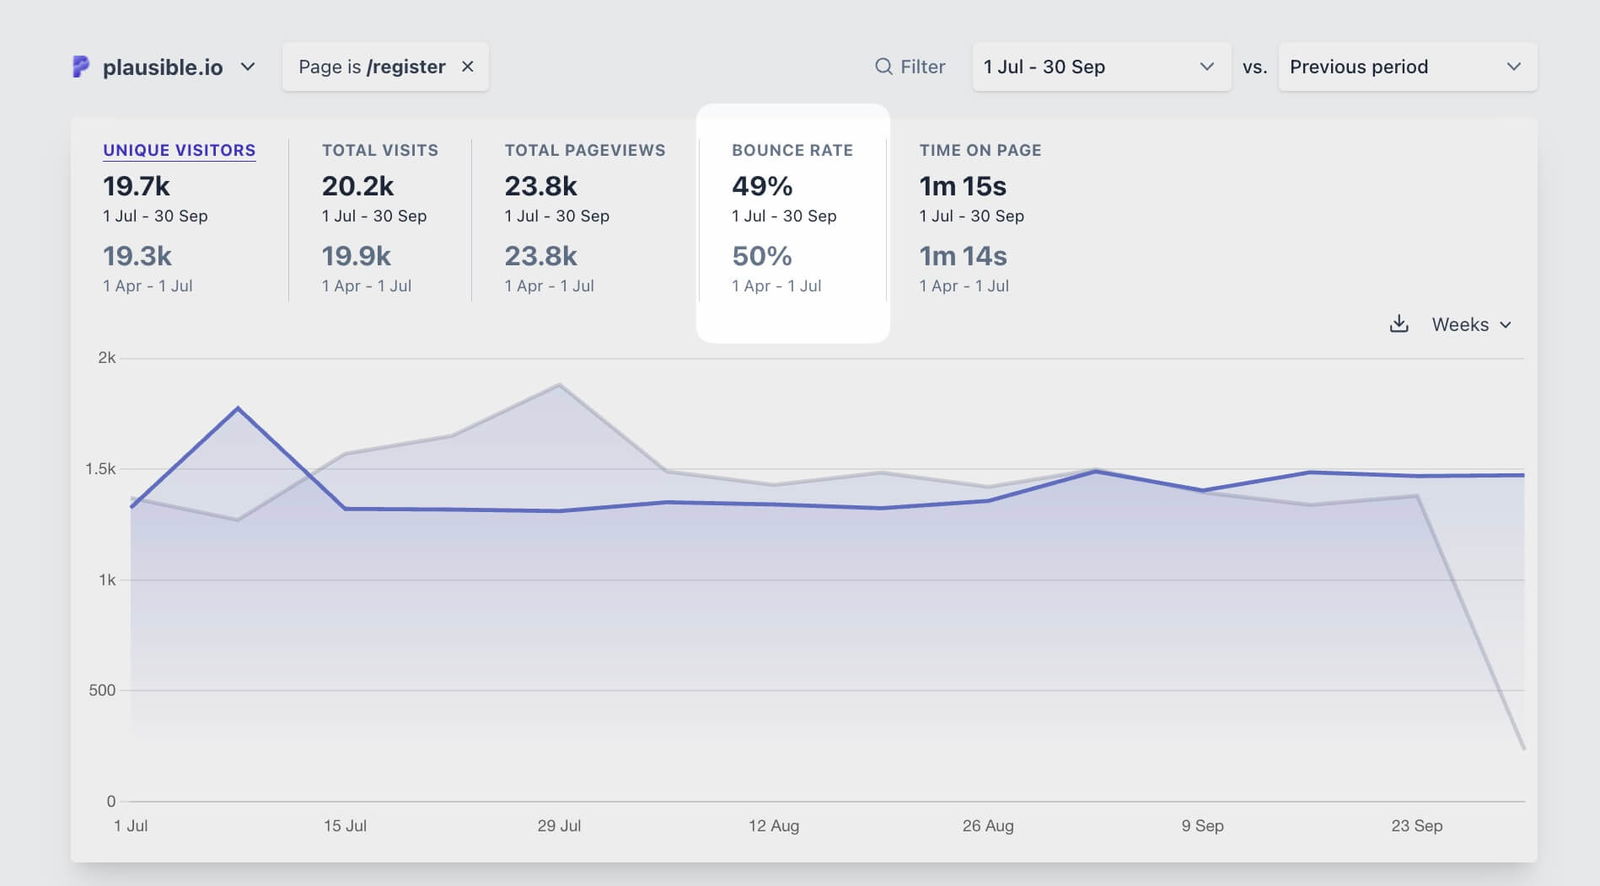
It can be seen that the bounce rate decreased by 1% from Q2 to Q3. It is a positive indicator.
Segment bounce rate by traffic sources
You can repeat the above exercise with your Top Sources report. For eg. If we compare how the sessions acquired to the Plausible site from Reddit engage in a comparison of Q3 from Q2, we see that the bounce rate has increased by 3%.
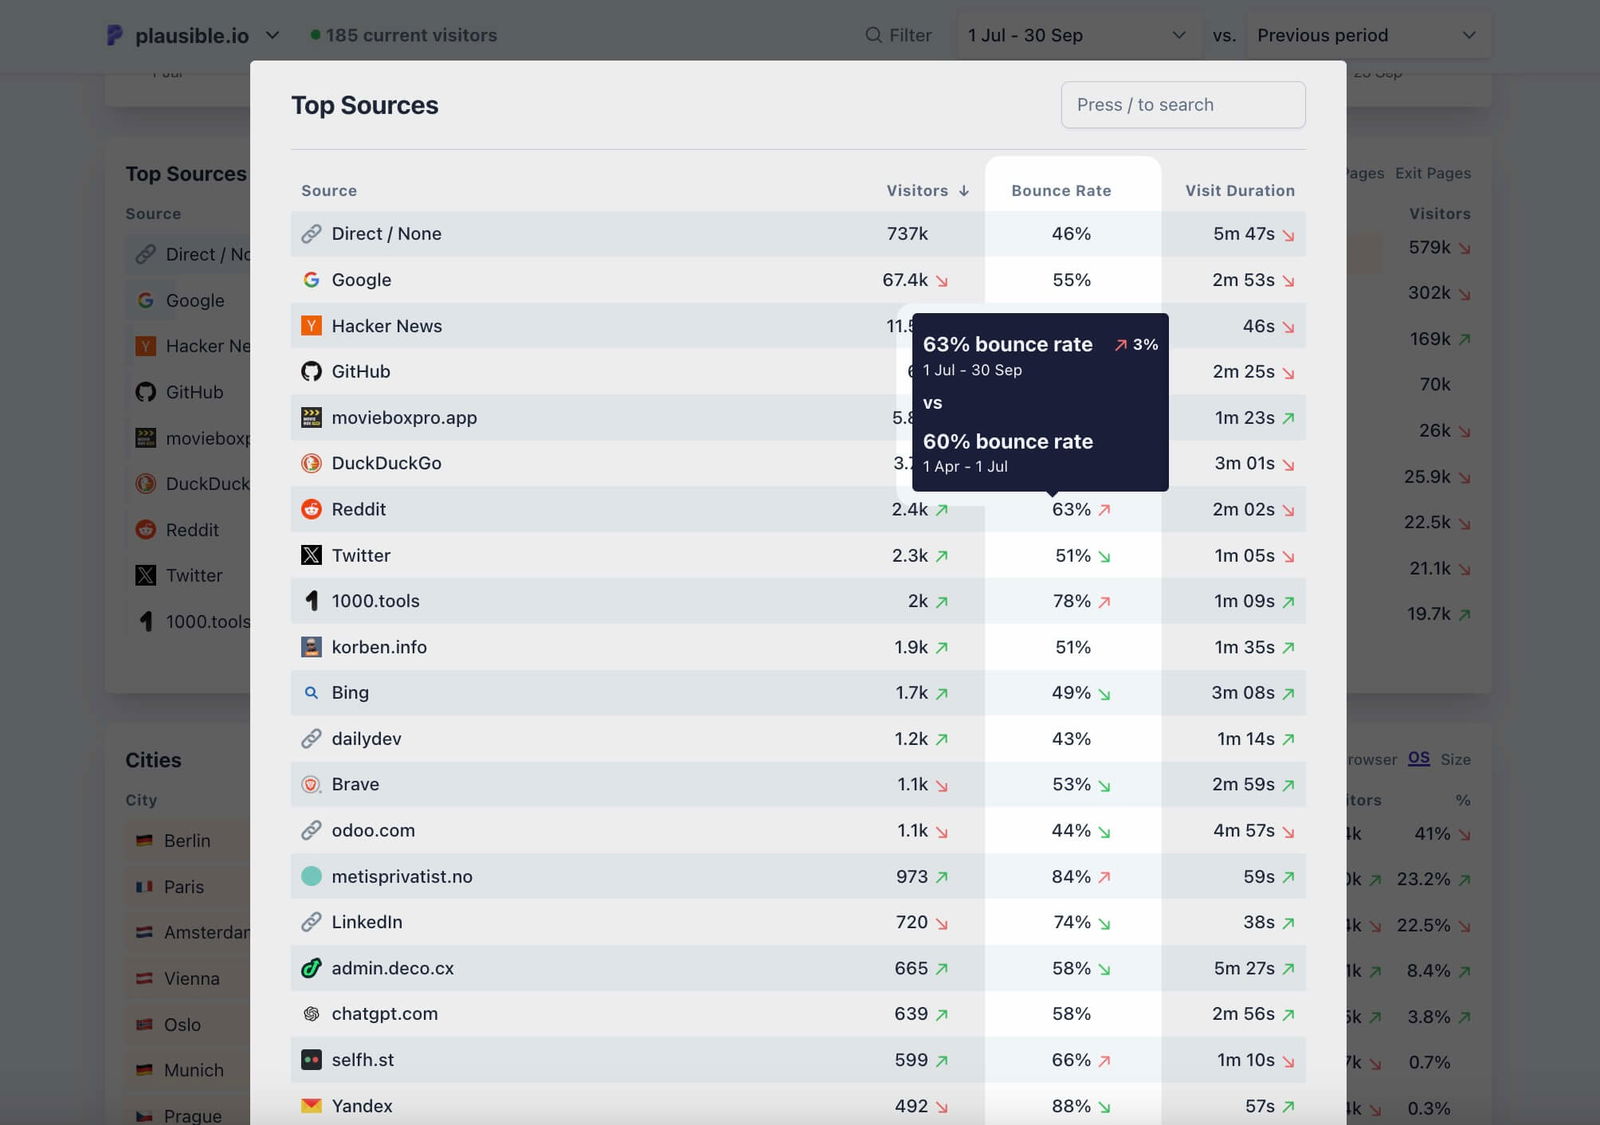
So we can dig further into the posts on Reddit that contributed to this traffic and see what caused this. Generally, it so happens that the messaging or intent of the post (whoever posted it) doesn’t match with that of the landing page, causing high bounce rates.
Segment bounce rate by locations and devices
Similar to above, you can explore your locations and devices/operating systems/device sizes reports on Plausible and analyze the respective bounce rates. With the locations reporting, you’ll need to use the filtering option to find out the bounce rate though.
Segment bounce rate by custom properties
Custom properties lets you track any additional data you want to track on your site. Here are some examples:
- Subscription Level – Tracks user subscription tiers, such as free, premium, or enterprise.
- Content Author – Identifies the author of a blog post or page for author-specific analytics.
- Logged-in Status – Differentiates between logged-in and logged-out users.
- Product Category – Tracks the category of a product viewed or purchased to understand trends.
The great news is that bounce rates can be segmented by this information too! For eg., we track our blog’s performance by authors in Plausible.
If I use the custom property filter to check the bounce rates associated with my content on the Plausible site (in a Q2 vs Q3 ‘24 comparison), we can see the metrics as following:
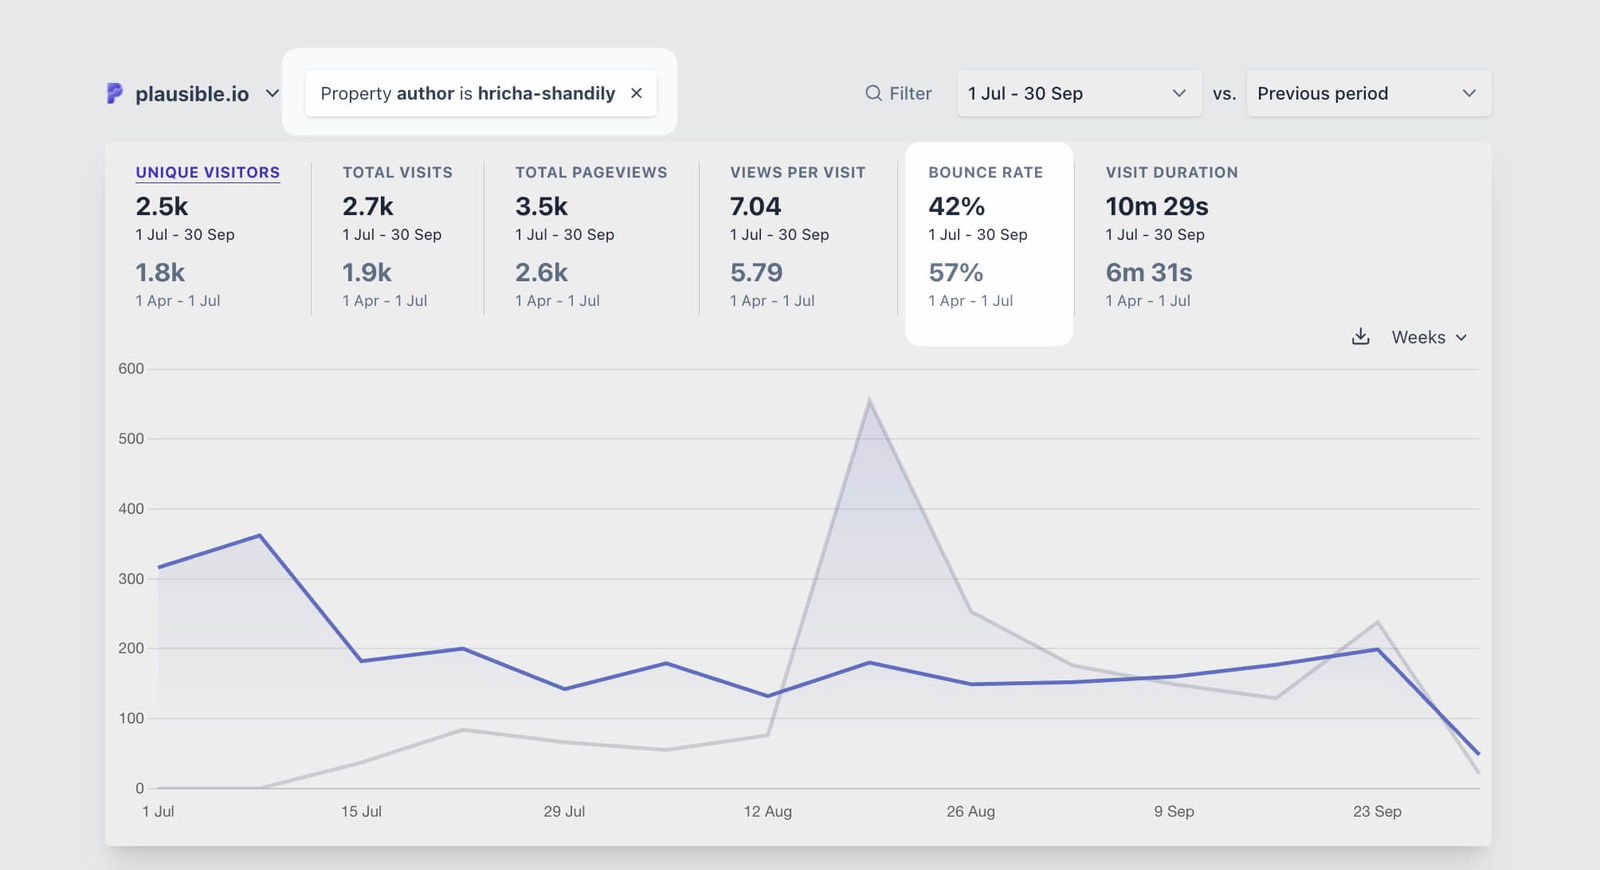
This way, you can pretty much evaluate the performance of any custom property you are using on your website.
More such examples can be: which category of products see high vs low bounce rates, which specific link text (e.g., ‘Download Now’ vs. ‘Learn More’) drives users to stay longer on the site, or which navigation menu items (e.g., ‘Pricing’ vs. ‘Features’) correlate with lower bounce rates.
And don’t forget, you can mix and match multiple filters to do a deeper analysis! Here’s one such segment to inspire you (click the “3 filters” beside the time range selector to understand the filters).
How to decrease your bounce rate?
Don’t try to aim for a zero bounce rate because it’s practically impossible and unnecessary for all sense and purposes. There will, for instance, always be people who land on your site by mistake and immediately exit.
Or, there will always be people with lower attention spans or may have found what they wanted and choose to return to your site at a later time.
Or, if the page is very straightforward and informative and gets to the root of what the user wants to know, such as contact pages, pricing, FAQs, etc., the visitor could bounce away with intentions of taking the conversation, and ultimate conversion, to another channel.
So, not every bounce warrants an optimization. There are some best practices you can apply to keep your bounce rates healthy.
Use relevant and engaging content
Choose the content format that resonates most with your audience. For instance, if you’re a fashion brand launching a new collection, visuals like photos and videos are likely to be more engaging than a long text-based article.
Understanding that the audience would feel excited about the new line by posting pictures and/or videos about the new product makes more sense and can actually lead to high engagement and low bounce rates.
Choose content formats that make sense for the topic and will keep people interested.
Know your audience
Unusually high bounce rates mean that either you haven’t found your right audience yet or you have the right audience but can’t produce relevant content for them yet.
Your content should feel relevant and useful to the people visiting your site. High bounce rates mean that visitors aren’t finding what they expected. Know your audience’s needs and address them to encourage visitors to explore more of your site.
This is something we do at Plausible, for instance. We know that many of our subscribers are frustrated Google Analytics users so we try to educate them about the differences between the two tools. And they are some of our most viral posts!
Make your site fast and mobile-friendly
A slow or hard-to-use site is a sure shot way to make people leave quickly, even if you created the perfect content for the perfect audience. Ensure your pages load very fast.
And don’t forget mobile users. A design that works well on mobile devices (if relevant to you) will ensure that at least visitors don’t bounce off because of subpar tech.
Avoid too many popups
Pop-ups can easily turn visitors off if they’re distracting or unrelated to the page. Keep them to a minimum, using them only when they really add value.
Match the page to visitor intent
If you’re seeing high bounce rates from a particular source, like email campaigns or social media, it could mean that visitors aren’t finding what they expected on the page. Make sure your landing page aligns with what’s promised in the link or ad.
This is also true for organic traffic from search engine clicks. You may rank for some keywords but if your content doesn’t match with the search intent, you’re likely to experience high bounce rates.
For example, if an email campaign is promoting a specific product or offer, ensure the landing page directly addresses it. This alignment helps visitors feel they’re in the right place, making them more likely to stay and engage further.
Maintain a good site structure
A well-organized site layout makes it easier for visitors to find what they’re looking for, keeping them on your site longer. Ensure clear navigation, with helpful internal links, footer links, subscription forms, and well-placed calls-to-action that encourage visitors to explore further. A/B testing can help in a more scientific approach to this.
A clean, intuitive design makes for a more enjoyable browsing experience, and clear paths (like menu bars, sidebars, and footers) help guide visitors naturally through the site.
Run experiments
You can optionally experiment with different approaches to help you learn what keeps visitors engaged. A/B testing, for example, allows you to try out two versions of a page to see which one performs better. You could also gather feedback from visitors on specific elements or content.
Bouncing off 👋
Lastly, high bounce rates isn’t the end of the world. You can surely find many ways out.
P.S. We are in the process of measuring the bounce rate metric in more ways than the typical one, making your life easier and stats more accurate. If you want to find out your site’s bounce rate, start a free trial now.